XAU/USD, XAG/USD PRICE FORECAST:
Gold prices are consolidating today following another attempt at the $2000/oz handle on Friday. Despite the weaker US Dollar we are seeing a slight recovery in US Yields and improving risk appetite which is sure capping gains for the precious commodity.
Supercharge your trading prowess with an in-depth analysis of gold’s outlook, offering insights from both fundamental and technical viewpoints. Claim your free Q4 trading guide now!
Recommended by Zain Vawda
Get Your Free Gold Forecast
US DATA WEAKENING?
The $2000/oz level has proved a real stumbling block for Gold and continues to be stubborn. As the Dollar weakens, we are yet to see this translate into gains for Gold and this could be down to the safe haven appeal waning as well. Although the geopolitical situation in the Middle East is yet to be resolved, there does seem to be growing optimism that a wider regional conflict may be averted. We can see the significant uptick from the start of last week when the Fear and Greed index hovered at the 30 mark in comparison with the 42, we are seeing today.
Source: FinancialJuice
Gold is likely to remain supported as there is still some appeal to holding the precious metal with a weaker US Dollar also helping to underpin Gold prices. At this stage however, if we are to see a sustained break above the $2000 handle, I believe we need to see continued weakness in US data to really drive home the idea that the Fed are done. Although this may benefit risk assets the most, I think USD weakness and weaker US fundamentals may be the push required for Gold to move sustainably higher.
The immediate downside risk for Gold prices lie in the improving sentiment and risk appetite which should it continue could push Gold toward a deeper retracement, possibly down to $1950. Given the extended rally to the upside this is a real possibility. There is also the case of the Gap in price to the downside which rests far away from current prices down at $1843/oz which still needs to be closed. This however, is more of a long-term prospect and is something which if we go by history could take a long a long time to close.
US 2Y and 10Y Yields, Daily Chart
Source: TradingView, Created by Zain Vawda
RISK EVENTS AHEAD
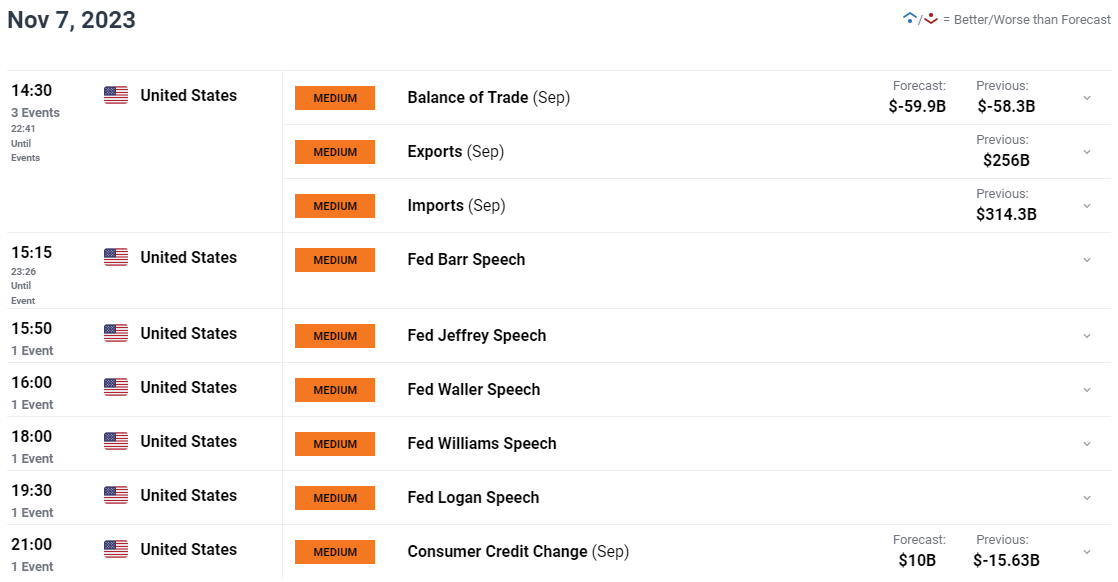
The next 48 hours brings a host of speeches from Federal Reserve policymakers with Fed Chair Powel rounding things off with comments on both Wednesday and Thursday. There shouldn’t be any surprises, but it will be intriguing to see whether there will be any attempts to quell market optimism that the Fed is done with rate hikes. It is important to note the comments of Fed policymaker Thomas Barkin who stated that it remains premature to make assumptions on the Fed outlook at the December meeting with two more inflation reports due before the Fed meeting likely to hold the key.
For all market-moving economic releases and events, see the DailyFX Calendar
TECHNICAL OUTLOOK
GOLD
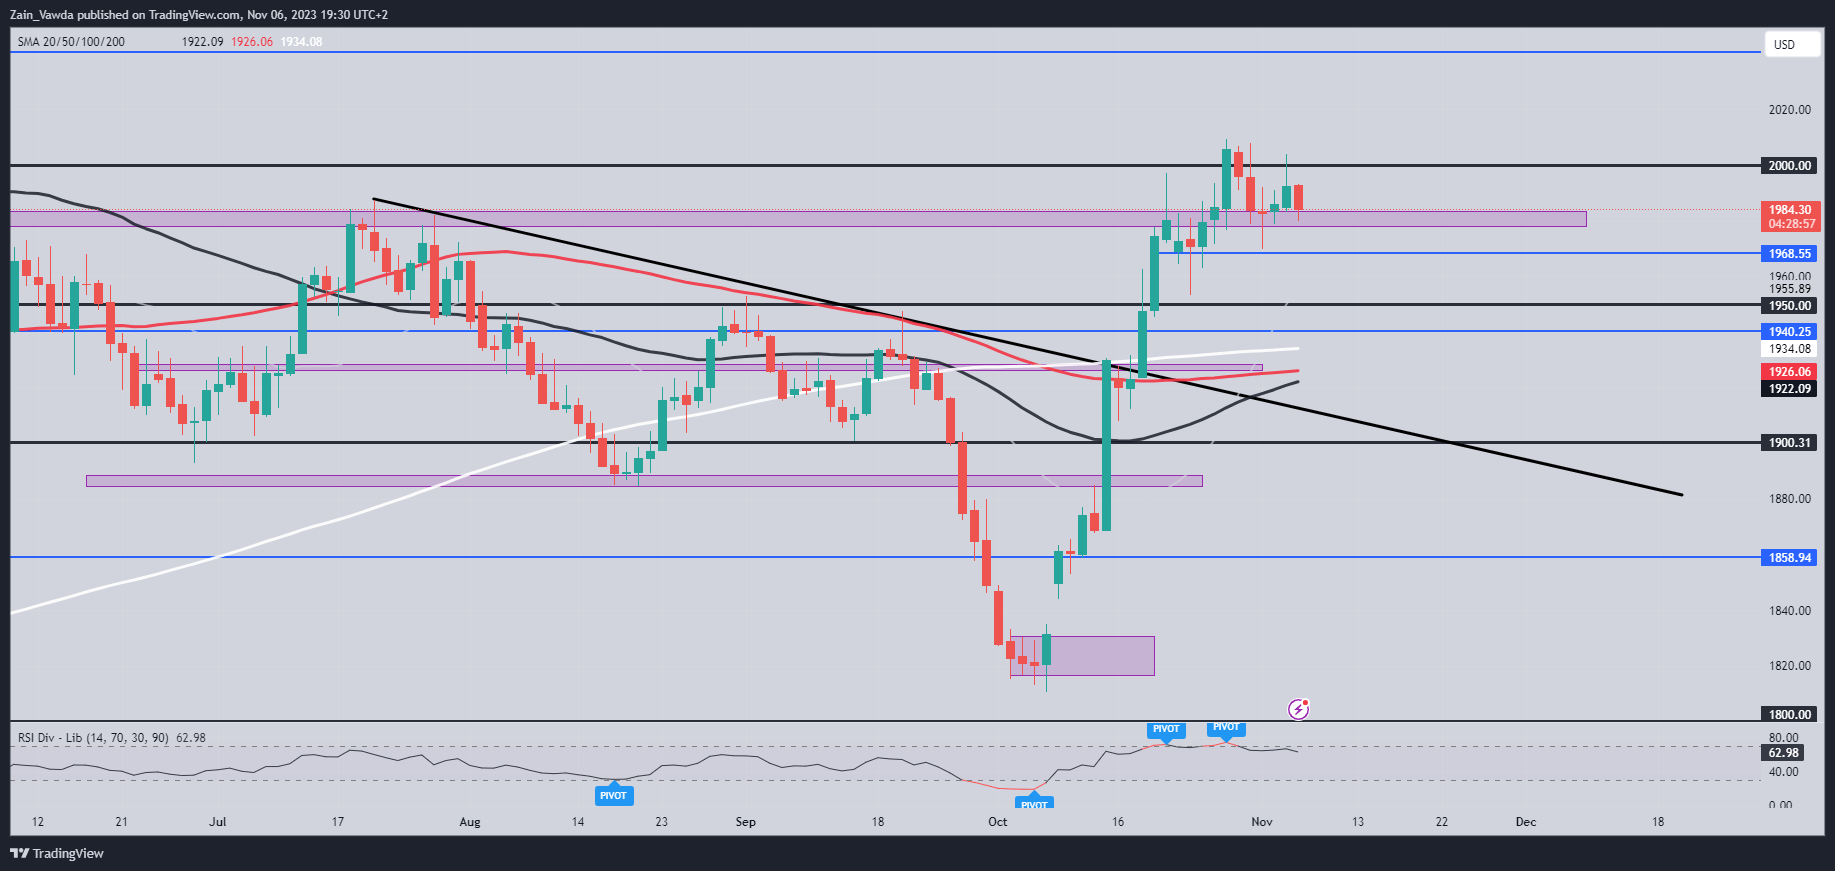
Form a technical perspective, Gold needs to hold above the $1977-1980 support area on the daily timeframe if the bullish momentum is to continue. There does however appear to be significant selling pressure around the $2000/oz mark evidenced by the various attempts to push higher failing. The Friday daily candle close as well left a significant upside wick in another nod to the selling pressure that remains prevalent around and above the $2000/oz mark.
The overall bullish structure remains intact without daily candle close below the $1968 support area. Taking this into account there is a real chance we could venture slightly lower below support at $1980 before bouncing from the $1968 area and attempting a renewed push toward the $2000/oz psychological area. The MAs meanwhile appear to be setting up for a golden cross pattern as the 50-day MA eyes a cross above the 100 and 200-day MAs, which is a sign of bullish momentum as well. A lot of mixed signals here and a lot of that has been down to the uncertain macro and geopolitical situations affecting volatility and aiding the uncertainty which has by and large plagued 2023.
Key Levels to Keep an Eye On:
Resistance levels:
Support levels:
Gold (XAU/USD) Daily Chart – November 6, 2023
Source: TradingView, Chart Prepared by Zain Vawda
XAG/USD
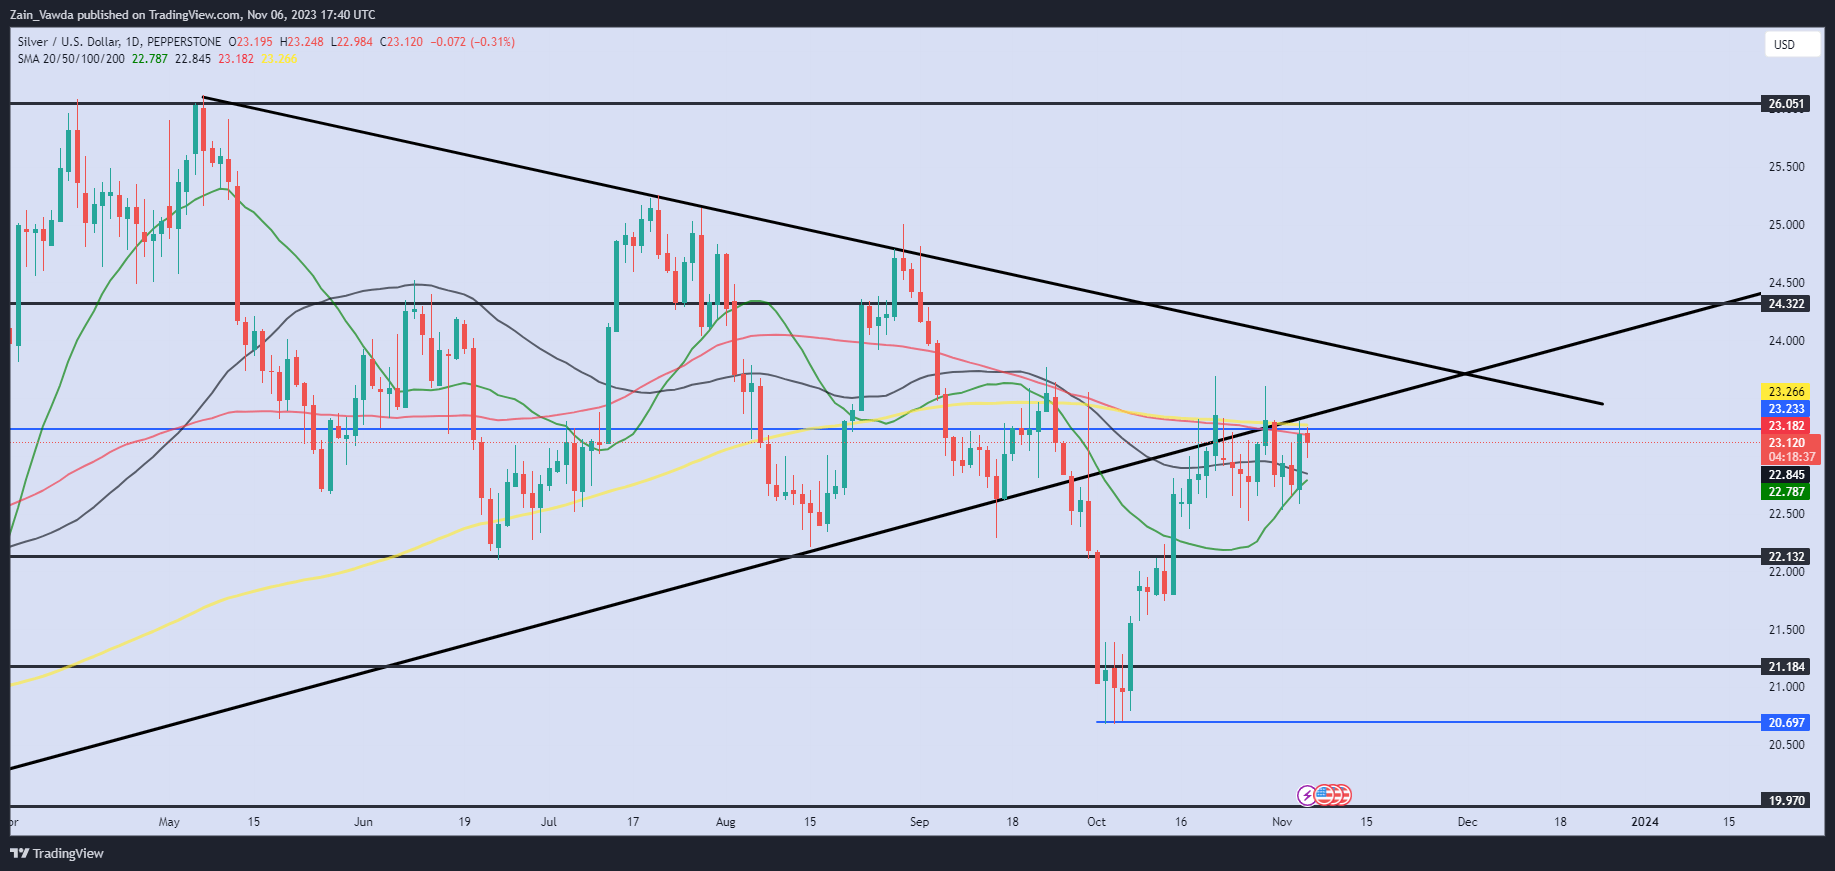
Silver on the other hand is actually pretty similar to Gold from a price action perspective. It appears we have printed a double top pattern and were poised for a move lower ahead of an explosive mov higher on Friday which has failed to find any momentum. We are hovering at a key resistance area around the 23.18 mark with the MAs also eyeing a golden cross here as well. The 20-day MA looks poised to break above the 50-day MA which would hint that the upside rally may not be done just yet.
Key Levels to Keep an Eye On:
Resistance levels:
Support levels:
Silver (XAGUSD) Daily Chart – November 6, 2023
Source: TradingView, Chart Prepared by Zain Vawda
IG CLIENT SENTIMENT
Taking a quick look at the IG Client Sentiment, retail traders are overwhelmingly Long on Silver with 87% of retail traders holding Long positions. Given the Contrarian View to Crowd Sentiment Adopted Here at DailyFX, is this a sign that Silver may continue to fall in the days ahead?
For a more in-depth look at SILVER client sentiment and tips and tricks n how to incorporate it in your trading, download the guide below.
| Change in | Longs | Shorts | OI |
| Daily | 1% | 1% | 1% |
| Weekly | 1% | 0% | 1% |
Written by: Zain Vawda, Markets Writer for DailyFX.com
Contact and follow Zain on Twitter: @zvawda


